

Visualising Borehole Data in Scene
Please note: In late 2020, Leapfrog Works received a significant update to its user interface. While the current version of Leapfrog looks quite different from the version used to record this video, most of this content is still valid as the layout, location of functions, and workflows remain largely the same.
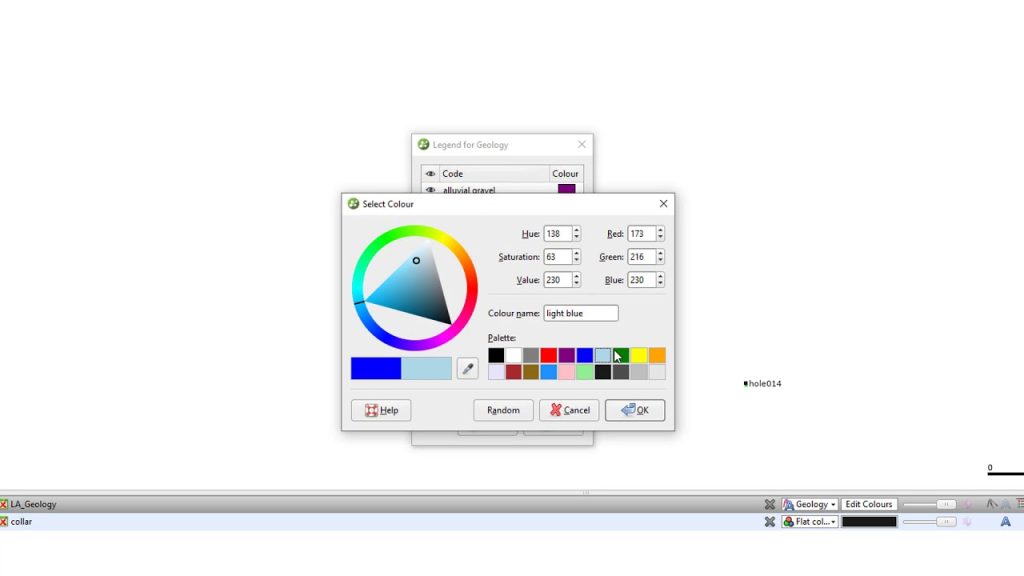
A noteworthy feature not mentioned in this video, is the ability to re-order the in-scene legend using arrows accessible from the Edit Colours dialogue box.
It is also now possible to display depth markers down boreholes. The depth markers exist on the Borehole traces object. To display, view the Borehole traces object in the scene, along with your interval table of choice, and tick the box in the properties panel to “Show depth marks”.
For more information about re-ordering the in-scene legend, displaying depth markers down boreholes, and other new features, please see the Leapfrog Works product page (https://my.seequent.com/products/leapfrog-works/latest).
Also, we are working to update our courses in MySeequent. As we do, you will find the most up to date information on Seequent Learning (https://lms.seequentlearning.com/dashboard).
0:00 – Introduction to borehole visualisation
0:20 – Viewing boreholes in the scene
0:32 – Introduction to shapes list and properties panel
0:51 – The properties panel
1:02 – Visualisation tools of the shapes list
3:01 – Exporting and importing borehole colourmaps
3:33 – Adjusting vertical exaggeration
Source
Responses