Description
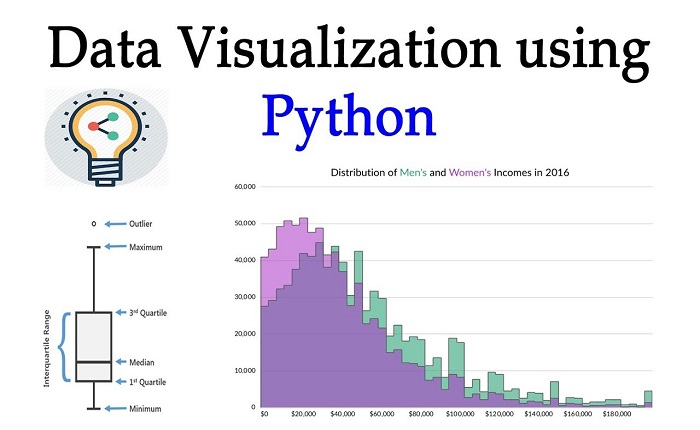
Python for Data Analysis and Visualization Course is an online course designed to help you learn the fundamentals of data analysis and visualization using Python. This course is perfect for those who are new to data analysis and visualization, as well as those who are looking to expand their knowledge and skills in this area.
The course covers the basics of Python programming, including data types, variables, functions, and control flow. You will also learn how to use Python to work with data, including how to read and write data from files, how to manipulate data using NumPy and Pandas, and how to visualize data using Matplotlib and Seaborn.
In addition to the fundamentals of Python programming, this course also covers the basics of data analysis and visualization. You will learn how to use Python to explore and analyze data, how to create meaningful visualizations, and how to interpret the results of your analysis.
The course also includes hands-on exercises and projects to help you practice and apply the concepts you learn. By the end of the course, you will have a solid understanding of the fundamentals of data analysis and visualization using Python.


